When the Yield Curve Twists and Turns
Share this article

In early April, shortly after the Federal Reserve’s first rate hike in four years, you may have heard the news that the yield curve had inverted and watched the crowd go wild with speculation. Is a recession definitely on the horizon now? Because in the past, yield curve inversion has often (but not always) been a predictor of a recession.
The yield curve quickly righted itself, but the noise about what its shape could be forecasting hasn’t died down. After a quick review of what yield curve inversion is, let’s cut through the clamor and see what our colleagues around Goldman Sachs think about using inversions in seeking to predict the future.
Yield curves – the basics
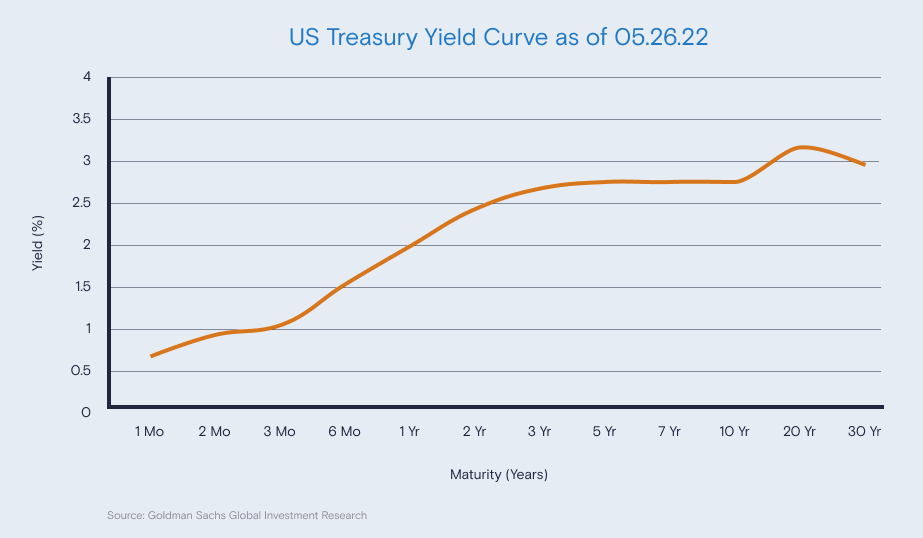
A yield curve chart plots current yields (interest rates) of bonds against their maturity dates (the date at which an investor will get their principal back). Yield curve charts can be created for bonds of all credit qualities and for different maturity ranges.
Charts of the US Treasury yield curve are widely watched, with particular interest paid to 2-year/10-year and 5-year/30-year spreads (the differences between yields for these bonds). You can find daily Treasury yield curve rates on the US Treasury website.
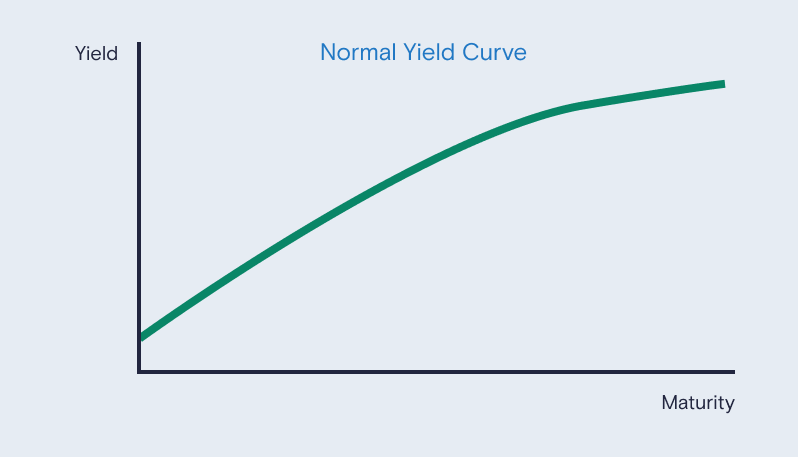
Yield curve shape matters – it’s been used as a way to gauge the direction of the economy. An upward sloping yield curve is normal, showing that interest rates get higher as maturities get longer. This makes sense. If you lend out your money for a longer period, you’re taking on more potential risk and it’s reasonable to expect to be paid more. A normal curve is generally taken as a sign that the economy is growing.
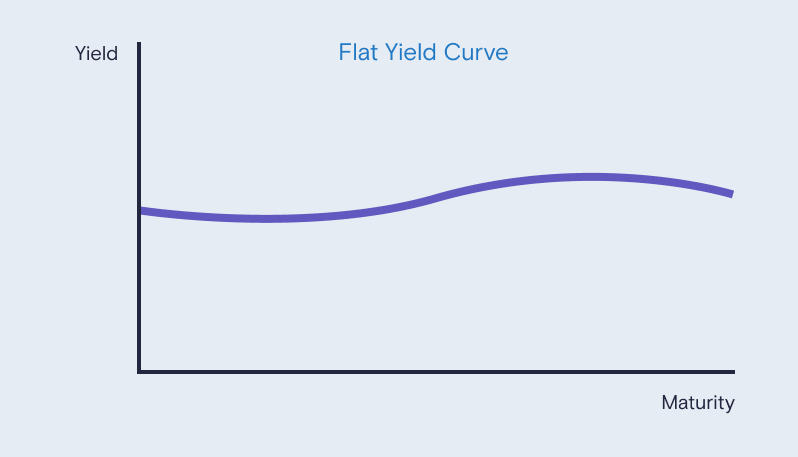
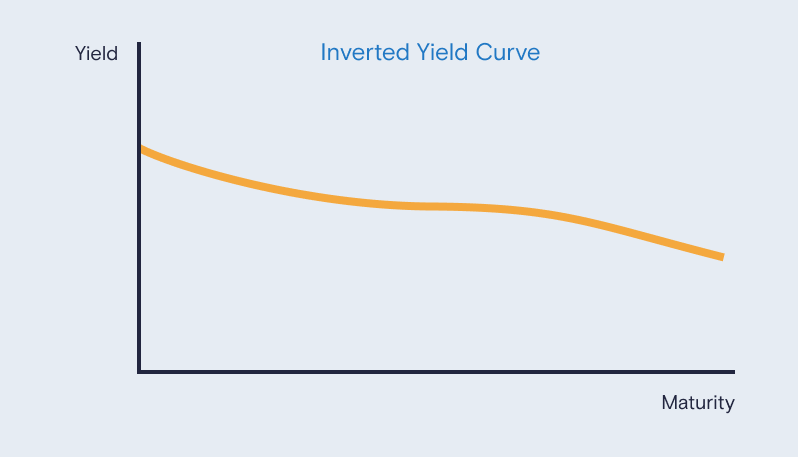
However, there are times when yield curves are flat – when all maturities have similar yields – and they can even slope downwards at times. A downward sloping or inverted curve means long-term interest rates are actually lower than short-term interest rates. That’s when the market can get concerned.
Why predictions based on yield curves aren’t really that simple
Yes, yield curves can often invert before a recession – but there’s more to the story. To shine more light on today’s situation, here are five deeper insights on yield curve inversion from our Goldman Sachs colleagues:
- The US Treasury yield curve can be thought of as one continuous curve across different maturities. Sometimes the spread between two maturities becomes inverted (for example, if a two-year bond offers a yield of 1.8% while a ten-year bond offers a yield of 1.5%), causing a kink in the curve. However, historically, recessions have followed an inversion of the majority of the yield curve. In the spring, the spreads between 2-year and 10-year Treasuries and between 5-year and 30-year Treasuries inverted, but other parts of the curve didn’t. And both of those inversions were very brief. Many economists believe the duration of inversion also matters.
- Not every yield curve inversion leads to recession – especially when inflation is high, according to our colleagues in Research. In the past, recessions came after real yield curves (adjusted for inflation) inverted and these are still sloping upward in 2022. The yield curves we usually see reported are nominal yield curves (not adjusted for inflation). These tend to invert more easily under high inflation conditions, so they may have to flex harder to signal a recession.
- As of May 2022, the Federal Reserve owns nearly $9 trillion in bonds and a quarter of the entire Treasury market. Plus, our Treasuries are currently very popular with foreign investors. High market demand tends to push prices up and long-term yields down, making it harder to use the yield curve as a recession predictor.
- The time between inversion and recession can be long and hard to predict. Historically, when a Goldman Sachs proprietary yield curve indicator has reached a critical point, a recession has taken place on average about 13 months later.
- And by the way…the S&P 500 has generally rallied after yield curve inversions, making them a poor signal to get out of the stock market.
How to think about the yield curve today
The yield curve today is flattish as a whole. However, with the Fed’s inflation-fighting policies underway, our colleagues expect inversions to happen more often. On the surface, this may look like a recession signal. But it’s important to look at the big picture and consider other metrics – statistics on wage growth and elevated household savings may counter that signal and suggest the economy can continue to grow .
The important takeaway: The view of our colleagues is that you generally shouldn’t rely on the yield curve or any one indicator to tell you if a recession is coming or what to do with your money. Although it’s an important metric, the yield curve is only one part of the story.
This article is for informational purposes only and is not a substitute for individualized professional advice. This article was prepared by and approved by Marcus by Goldman Sachs, but does not reflect the institutional opinions of Goldman Sachs Bank USA, Goldman Sachs Group, Inc. or any of their affiliates, subsidiaries or divisions. Goldman Sachs Bank USA is not providing any financial, economic, legal, accounting, tax or other recommendation in this article. Information and opinions expressed in this article are as of the date of this material only and subject to change without notice. Information contained in this article does not constitute the provision of investment advice by Goldman Sachs Bank USA or any its affiliates. Neither Goldman Sachs Bank USA nor any of its affiliates makes any representations or warranties, express or implied, as to the accuracy or completeness of the statements or any information contained in this document and any liability therefore is expressly disclaimed.
Investing involves risk, including the potential loss of money invested. Past performance does not guarantee future results. Neither asset diversification or investment in a continuous or periodic investment plan guarantees a profit or protects against a loss.
Related Content

 3 min read


Connect with us on social media
Join our Marcus social media community, where we share content and inspiration to help improve your financial health. See you there!