Two Inflation Tales – Which Should We Believe?
Share this article

CPI. PCE. It’s the alphabet soup of inflation data. CPI is the Consumer Price Index, produced by the Bureau of Labor Statistics (BLS). PCE refers to the Personal Consumption Expenditures price index from the Bureau of Economic Analysis (BEA). Both indices were developed to measure changes in the prices we pay for goods and services we normally use.
They both show us how inflation is trending. But sometimes they don’t seem to tell the same story.
For example, in June 2022, the CPI showed annual inflation had reached 9.1% while the PCE price index measured it at 6.8%. That’s the largest gap since 1981.
So which index gives us the true picture of inflation? Both are accurate but they measure things a little differently. And when they don’t agree, it can actually clue us into changing consumer behavior. We’ll explain how ahead.
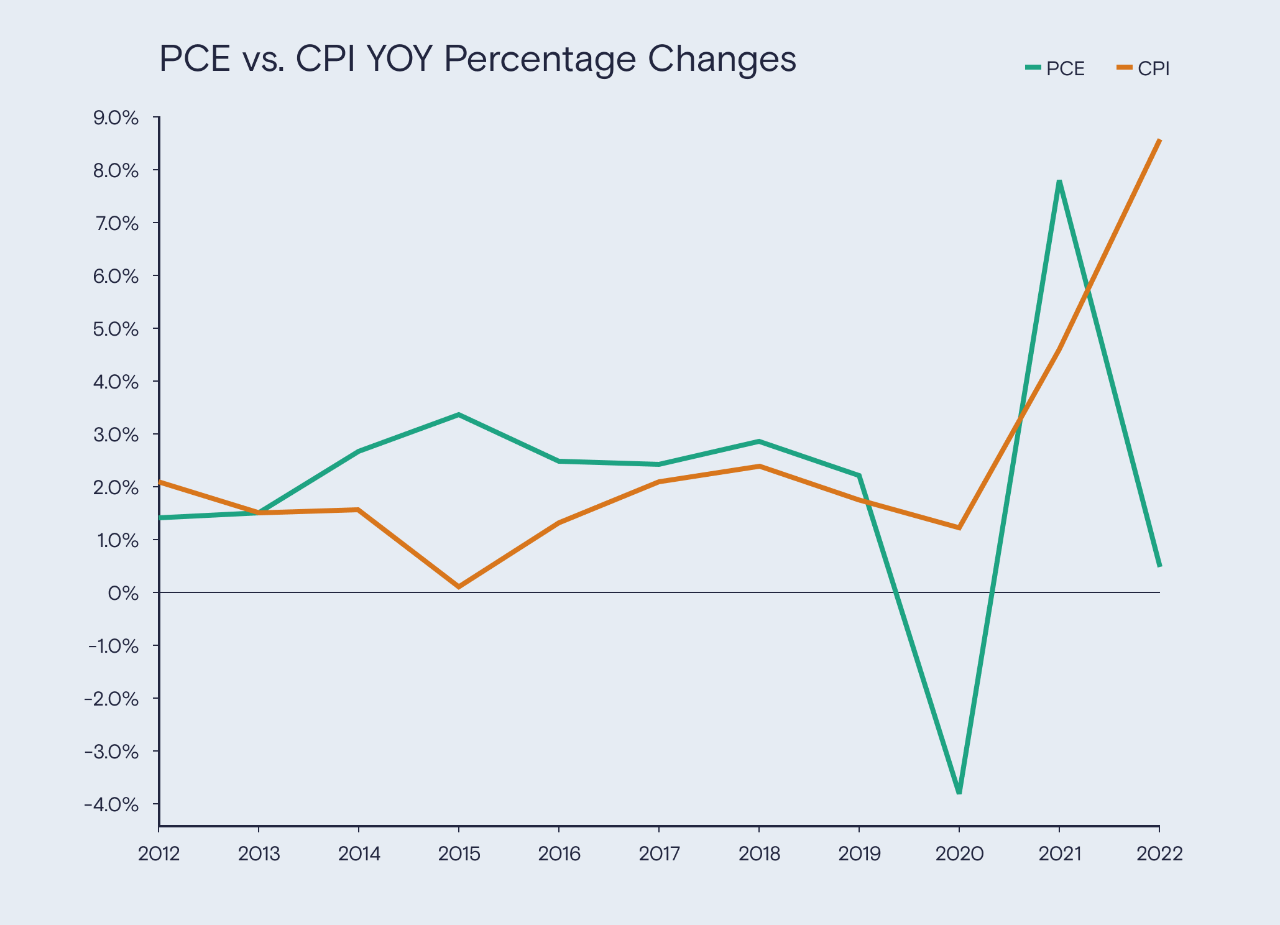
Sources: Bureau of Economic Analysis and Federal Reserve Bank of Minneapolis
CPI vs PCE: A brief overview
Let’s dig into some of details of the CPI and PCE price index. Why do these two metrics produce different inflation numbers?
Every two years, the BLS surveys a selection of consumers about their purchasing habits in order to create the CPI “market basket” of goods and services.
The PCE price index, on the other hand, is based on quarterly data from businesses about customer purchases. Both indices are updated monthly with current pricing figures.
There are lots of ways in which these indices end up measuring prices differently. However, two factors that probably contributed to the outsized 2022 gap between them are weighting and the substitution effect.
Weighting, or what matters most, in each index
In both indices, each good and service is “weighted” by how the index population distributes its spending. Housing tends to be a larger budget item than toiletries, for example, so housing is given more relative importance in the index. But the indices don’t weight items the same because they track different numbers of items and use different data sources – as we mentioned earlier, the CPI gets information from consumers, and the PCE index gets information from businesses.
To understand the gap in 2022, let’s review some weighting differences:
- Compared with the CPI, the PCE index measures a more comprehensive basket of items, including items bought on behalf of consumers by third parties, like health insurance purchased by employers.
- Shelter makes up 33% of CPI but just 16% on average of the PCE price index.
- Gasoline also has a higher weighting in the CPI.
When rents and energy costs rise faster than other prices, CPI inflation tends to run higher than PCE inflation. And according to the Bureau of Economic Analysis, the two spending categories that increased the most year-over-year as of May 2022 were (1) housing and utilities and (2) gasoline and other energy goods.
So weighting is part of the reason we’re seeing two different inflation numbers from the PCE and CPI.
The substitution effect: When you buy something cheaper
Human behavior is another factor in the difference between these indices. There are two ways we can respond to inflation’s pressure on our budgets. For one, we can stop/reduce our purchases of expensive items. For example, we can drive less or buy an electric car to cut down on expensive gasoline. If this behavior is sustained, it’s known as “demand destruction.”
However, we don’t put spending completely on hold when inflation overheats. When prices go up for our favorite items, we may just switch to cheaper items. When steak is high, we may buy chicken instead. Or we switch from major-brand goods to store brand items. Going out to eat? You may decide to nosh at a local taco joint instead of sitting down at an upscale seafood restaurant.
Choosing to buy a cheaper alternative when costs rise is known as the substitution effect, and not accounting for it can overstate inflation. The PCE may catch these substitutions more effectively than the CPI. Why? Because the PCE changes its market basket every quarter rather than every two years (like the CPI) which helps the PCE take real-life human behavior into account. This may be another reason the CPI hovers above the PCE price index. Yes, the prices for specific items may have skyrocketed, but they won’t affect our cost of living as much if we’ve turned to less costly options to save money.
To be fair to the CPI, its formula was adjusted in 1999 to account for modest consumer substitution within item categories. Today’s CPI takes into account that we might buy a cheaper brand of smartphone when prices rise. But it still doesn’t reflect the fact that we might buy chicken instead of steak or skip the new car in favor of a monthly bus pass.
Here’s a fun fact: The PCE price index is the Federal Reserve’s preferred measure of inflation. This doesn’t mean they ignore the CPI. In fact, Chair Powell specifically referenced the CPI when explaining their 0.75% June rate hike. That’s because the CPI is a much-watched index that affects our inflation expectations. However, the Fed itself believes that the PCE price index is better at incorporating short-term changes in consumer spending habits that often occur as price trends change.
Your inflation, my inflation, the Fed’s inflation
Back to our original question: Which index should we believe? Well, it depends. As we’ve said, they both accurately measure price changes, but for slightly different baskets of goods and in slightly different ways.
Let’s face it, neither index is likely to accurately reflect your personal experience of inflation. These are statistics, based on a large number of diverse households that may not spend money the way you do. (But comparing your own spending to the CPI weightings may offer clues to inflation’s impact on your own budget.)
Both indices, however, can be useful in gauging the mood of the country and potential future inflation trends, as well as in understanding Fed actions, if you know what each one is looking at. One last piece of historical context that might help: With enough time, the numbers from the two indices tend to converge, and the CPI historically moves toward the PCE. If that happens this time around, our inflation woes could be less severe than we expect.as we mentioned earlier, the CPI gets information from consumers, and the PCE index gets information from businesses.
This article is for informational purposes only and is not a substitute for individualized professional advice. Individuals should consult their own tax advisor for matters specific to their own taxes and nothing communicated to you herein should be considered tax advice. This article was prepared by and approved by Marcus by Goldman Sachs, but does not reflect the institutional opinions of Goldman Sachs Bank USA, Goldman Sachs Group, Inc. or any of their affiliates, subsidiaries or division. Goldman Sachs Bank USA does not provide any financial, economic, legal, accounting, tax or other recommendation in this article. Information and opinions expressed in this article are as of the date of this material only and subject to change without notice. Information contained in this article does not constitute the provision of investment advice by Goldman Sachs Bank USA or any its affiliates. Neither Goldman Sachs Bank USA nor any of its affiliates makes any representations or warranties, express or implied, as to the accuracy or completeness of the statements or any information contained in this document and any liability therefore is expressly disclaimed.
Related Content

 1 min read


Connect with us on social media
Join our Marcus social media community, where we share content and inspiration to help improve your financial health. See you there!